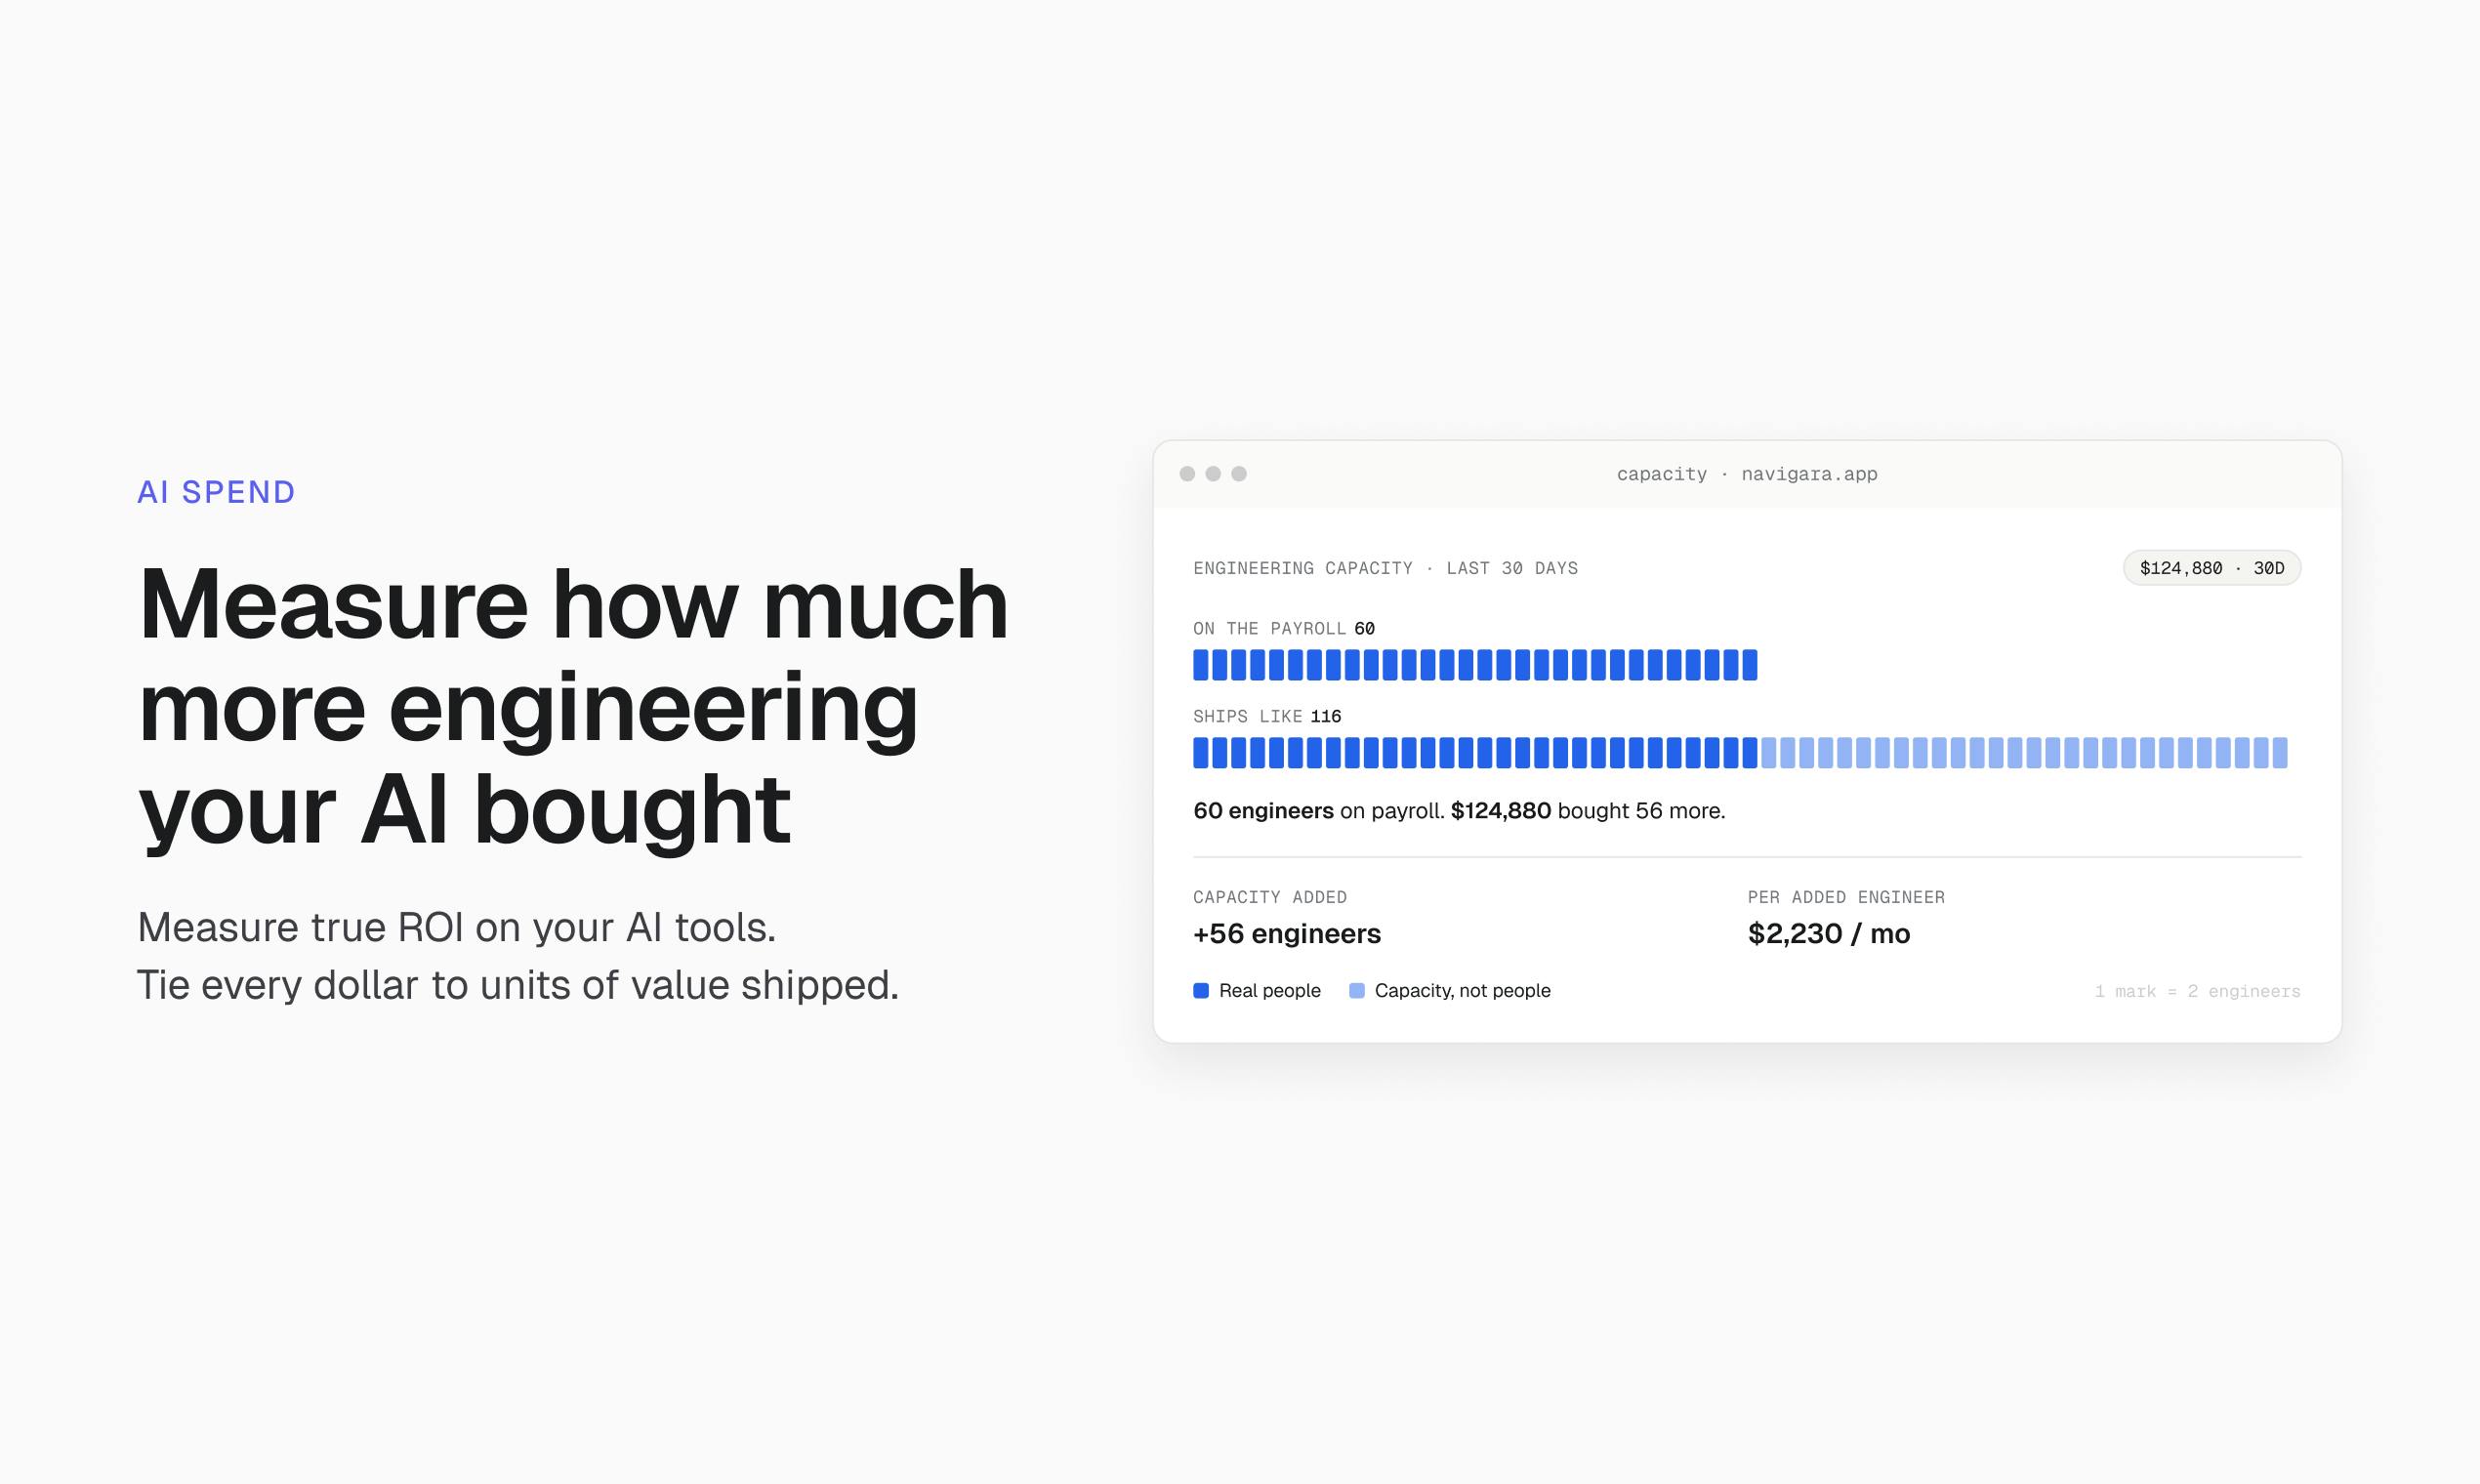
I spent years as a CTO trusting the velocity charts, cycle times, right up until I realized they were telling me a story I couldn't back up. Then a CFO asked whether Claude was producing real value for almost $150k a month or just producing invoices, and the honest answer was "we think so." Try saying that out loud while asking for a bigger token budget.
So we built Navigara. It reads your commit history, uses an LLM to understand the repo and explain what each change did, then scores how complex the merged work was. Not lines, not commits. Refactor 400 lines down to 40 and you score higher than shipping 400 more. Full methodology behind Engineering Throughput Value: https://500.navigara.com/methodology. ETV splits into Features, Maintenance, and Documentation. We measure against your team's own pre-AI baseline.
We pointed it at open source first and created a white paper about this. The result? Across the public commit history of Microsoft, Google, Cloudflare, OpenAI, Meta, and Vercel, ETV per engineer rose 116% between Q1 2025 and Q1 2026, measured across 676 contributors.
Then we noticed that a lot of the performance and code created inside companies was not aligned with the company roadmap. So the spend was high and a lot of PRs were generated, but the roadmap did not move that much faster. So we connected token spend to the roadmap (initiatives, epics, and tickets) to see what work is aligned with your roadmap, what just has a ticket without an initiative, and what is unaligned with your roadmap and put number in $ next to it.
Here’s the part I care about most: Lead engineering with data. My engineering team's ETV per engineer is up 4x against our own pre-AI baseline. We are realizing that process issues between epics, tickets, AI spend, and code are the source of teams slowing down as they grow in headcount. If you care about this too, check out “Process Checks.” It is like Sentry, but for engineering processes.
You can start a 14-day trial, or just poke around at navigara.com first. If you think we're measuring engineering wrong → That's the feedback I really want.
Jirka
PH 用户
What really caught my attention here is the connection between AI spend and actual roadmap progress. It’s easy to celebrate more AI-generated code, but much harder to know whether that work is creating meaningful engineering value. Linking spend, code changes, and roadmap outcomes feels like a much more useful way to measure AI productivity. Curious to see how teams use Navigara’s insights to make better decisions about where their AI budget actually goes. Great launch!
PH 用户
how do you account for engineers who spend significant time mentoring, designing systems or unblocking teammates?
PH 用户
The idea of measuring AI engineering spend against actual product progress is really compelling. A lot of teams can track how much AI they use, but not necessarily whether that usage is moving the roadmap forward. Navigara seems to address that missing layer really well. Excited to see how this evolves.
PH 用户
Navigara tackling the gap between AI spend and roadmap alignment is powerful—ETV feels like a much-needed lens for engineering leaders. Love that it highlights process issues as teams scale, not just raw output. Curious to see how teams respond when they start leading with this kind of data. Great product!
I'm Jirka, co-founder of Navigara.
I spent years as a CTO trusting the velocity charts, cycle times, right up until I realized they were telling me a story I couldn't back up. Then a CFO asked whether Claude was producing real value for almost $150k a month or just producing invoices, and the honest answer was "we think so." Try saying that out loud while asking for a bigger token budget.
So we built Navigara. It reads your commit history, uses an LLM to understand the repo and explain what each change did, then scores how complex the merged work was. Not lines, not commits. Refactor 400 lines down to 40 and you score higher than shipping 400 more. Full methodology behind Engineering Throughput Value: https://500.navigara.com/methodology. ETV splits into Features, Maintenance, and Documentation. We measure against your team's own pre-AI baseline.
We pointed it at open source first and created a white paper about this. The result? Across the public commit history of Microsoft, Google, Cloudflare, OpenAI, Meta, and Vercel, ETV per engineer rose 116% between Q1 2025 and Q1 2026, measured across 676 contributors.
Then we noticed that a lot of the performance and code created inside companies was not aligned with the company roadmap. So the spend was high and a lot of PRs were generated, but the roadmap did not move that much faster. So we connected token spend to the roadmap (initiatives, epics, and tickets) to see what work is aligned with your roadmap, what just has a ticket without an initiative, and what is unaligned with your roadmap and put number in $ next to it.
Here’s the part I care about most: Lead engineering with data. My engineering team's ETV per engineer is up 4x against our own pre-AI baseline. We are realizing that process issues between epics, tickets, AI spend, and code are the source of teams slowing down as they grow in headcount. If you care about this too, check out “Process Checks.” It is like Sentry, but for engineering processes.
You can start a 14-day trial, or just poke around at navigara.com first. If you think we're measuring engineering wrong → That's the feedback I really want.
Jirka