Hey Product Hunt! I'm Jyotishmoy, the maker of Tracellm.
Like many developers, I've been building AI applications using different LLMs and frameworks. One thing quickly became obvious: once an AI app reaches production, it's surprisingly difficult to understand what's actually happening.
Questions like:
Why did this request fail? Which prompt caused the issue? How many tokens did this interaction consume? Where is the latency coming from? Which model call is slowing everything down?
There are great observability tools for traditional applications, but I wanted something purpose-built for AI workloads.
That's why I built Tracellm.
Tracellm gives developers complete visibility into their AI applications by tracing prompts, spans, token usage, latency, model calls, and errors in one place. It also supports OpenTelemetry (OTLP), making it easy to integrate with your existing observability stack.
This is just the beginning. I have a lot more planned, including richer analytics, cost optimization insights, and support for more AI frameworks and providers.
I'd genuinely love your feedback:
What features would make this indispensable for your workflow? Which AI framework or model provider should I support next? What would you like to see improved?
Thanks so much for checking out Tracellm! I'm excited to answer your questions throughout the launch.
please give it a "⭐" in GitHub if you find this helpful.
PH 用户
This looks super useful — OpenTelemetry-based observability for LLM apps is a great idea, especially catching bottlenecks early. Congrats on shipping!
PH 用户
Every question on that list is about a failure that announces itself. Failed request, slow call, token spike, all visible.
The one that costs most in production is the request that succeeded. No error, normal latency, sensible token count, and the answer was confidently wrong. To catch that afterwards the trace has to hold what the turn was grounded in, which retrieval actually landed and what the tool returned, attributed to that turn. Otherwise the worst incident of the year looks like a healthy span.
Does a span carry the retrieved content and tool results, or the call and the timing only?
PH 用户
OTLP as the export path is the right bet, but it moves the hard problem rather than solving it. The moment a prompt body leaves for someone's existing stack it lands under retention and access rules it was never collected under, so the first thing I'd want to know is whether payload capture is opt in per span and whether I can strip it at the collector rather than in the SDK. Worth answering on the page, because that's the question that decides whether this gets past a security review or dies in one.
PH 用户
The redaction point further up is the one that decides whether we could even turn this on. Full request and response bodies leaving our infra to a third party is a hard no on anything finance adjacent unless PII gets scrubbed before export, not after. Is that per field configurable or a fixed blanket list?
Like many developers, I've been building AI applications using different LLMs and frameworks. One thing quickly became obvious: once an AI app reaches production, it's surprisingly difficult to understand what's actually happening.
Questions like:
Why did this request fail?
Which prompt caused the issue?
How many tokens did this interaction consume?
Where is the latency coming from?
Which model call is slowing everything down?
There are great observability tools for traditional applications, but I wanted something purpose-built for AI workloads.
That's why I built Tracellm.
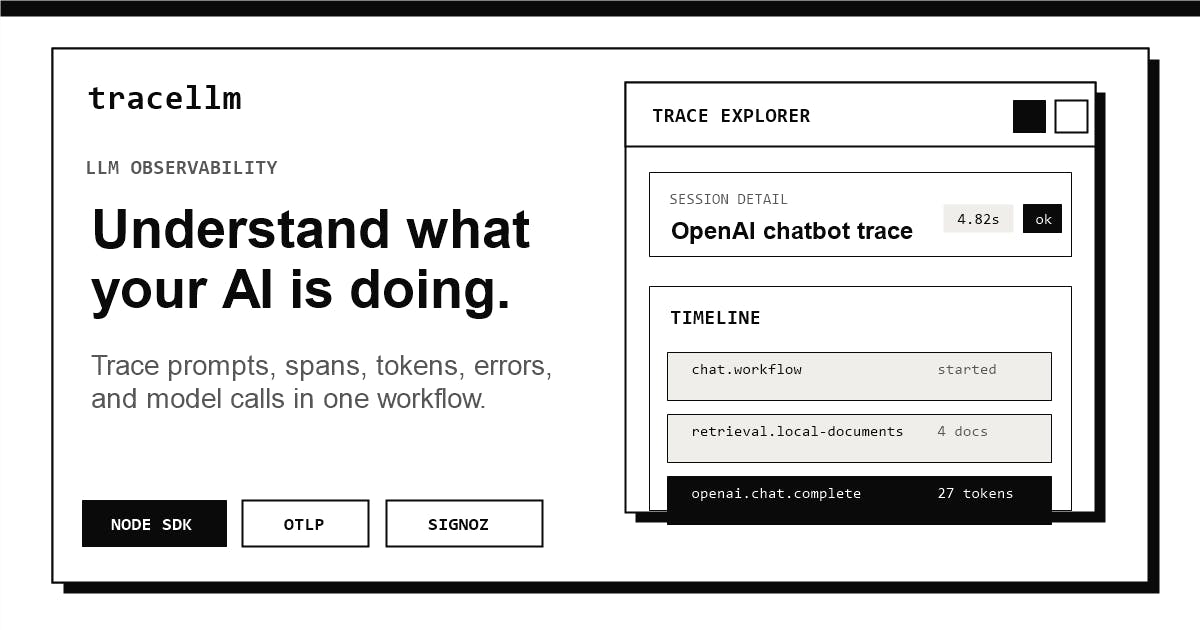
Tracellm gives developers complete visibility into their AI applications by tracing prompts, spans, token usage, latency, model calls, and errors in one place. It also supports OpenTelemetry (OTLP), making it easy to integrate with your existing observability stack.
This is just the beginning. I have a lot more planned, including richer analytics, cost optimization insights, and support for more AI frameworks and providers.
I'd genuinely love your feedback:
What features would make this indispensable for your workflow?
Which AI framework or model provider should I support next?
What would you like to see improved?
Thanks so much for checking out Tracellm! I'm excited to answer your questions throughout the launch.
please give it a "⭐" in GitHub if you find this helpful.
The one that costs most in production is the request that succeeded. No error, normal latency, sensible token count, and the answer was confidently wrong. To catch that afterwards the trace has to hold what the turn was grounded in, which retrieval actually landed and what the tool returned, attributed to that turn. Otherwise the worst incident of the year looks like a healthy span.
Does a span carry the retrieved content and tool results, or the call and the timing only?