面向 AI 开发团队的 LLM/智能体可观测性工具,追踪模型、工具、服务与数据库调用,定位成本、时延和质量问题。
热门评论
PH 用户
Hi Product Hunt, Ashish here, Head of Engineering at OpenObserve.
If your AI agent got stuck in a tool-call loop right now, would you know? Would you spot it before your customer did?
We didn't.
During a live demo, our own AI SRE Agent silently stalled. No errors. No timeouts. Nothing useful in the logs. We had to dump raw spans and debugged through them just to find the loop.
Reading raw spans isn't a debugging strategy—it’s an apology waiting to happen.
So we built AI Observability directly into OpenObserve. We wanted to see inside the black box.
Here is what it actually gives you:Sessions map out every single turn. You see every LLM request, tool call, token count, cost, and exactly what prompt caching saved you.Agent Graph plots your agents, tools, and models onto the exact same service map as the rest of your backend infrastructure.Agent Behavior automatically flags the sessions that loop or fail—long before a user complains.Online Evals let you score live sessions using any judge model (bring your own provider and key).Annotation Queues let you turn those ugly, failed sessions into clean datasets so you can regression-test your fixes. The best part? It's OpenTelemetry-native.
It normalizes OTel GenAI, OpenInference, OpenLLMetry, and Vercel AI SDK and many more out of the box. Nothing you’ve already wired up goes to waste, and you don’t have to ship a second copy of your data to another platform.
Our SRE Agent runs on this daily now, and it's still our harshest critic.
Point it at your own agent traces. I'd love to hear what you find.
PH 用户
Hi guys, Hengfei here, I designed this module, so let me add the part the launch page doesn't cover — what we deliberately chose not to build.
Sessions, not calls. Most LLM tracing anchors on a single request. But agents don't fail at a call — they fail across a path: right answer, wrong tool, fourteen times. So the session is the first-class object, and cost, tokens and scores roll up to it. Spans are the substrate, not the unit of analysis.
One data layer. We could have shipped a separate AI observability product. We didn't — because half of what kills an agent isn't the model. It's a vector DB timing out, a 429 from a downstream service, a retry storm in your own API. If agent spans live in a different system than your infra traces, you get to debug the same incident twice.
Scores are append-only. An evaluation is data, not a label. Change your judge prompt and the old scores don't get overwritten — they get a new version. Otherwise "quality improved" is unfalsifiable.
Bring your own judge. The judge model is yours, self-hosted open weights included. Evaluating production traffic shouldn't require shipping production traffic to someone else.
One thing that genuinely surprised me while building this: the OTel GenAI semconv renamed core attributes twice in two years (gen_ai.system → provider.name, events → input/output.messages). Betting on a fixed schema would have been the real mistake. The mapping layer turned out to be the feature.
What's the worst agent failure you've had to debug straight from raw spans? Collecting these — seriously.
PH 用户
Hi Product Hunt, Simran here from the OpenObserve team.
One thing we kept running into while working with AI workloads: an LLM call can succeed while the agent still fails.
That’s the gap we wanted to solve with AI Observability.
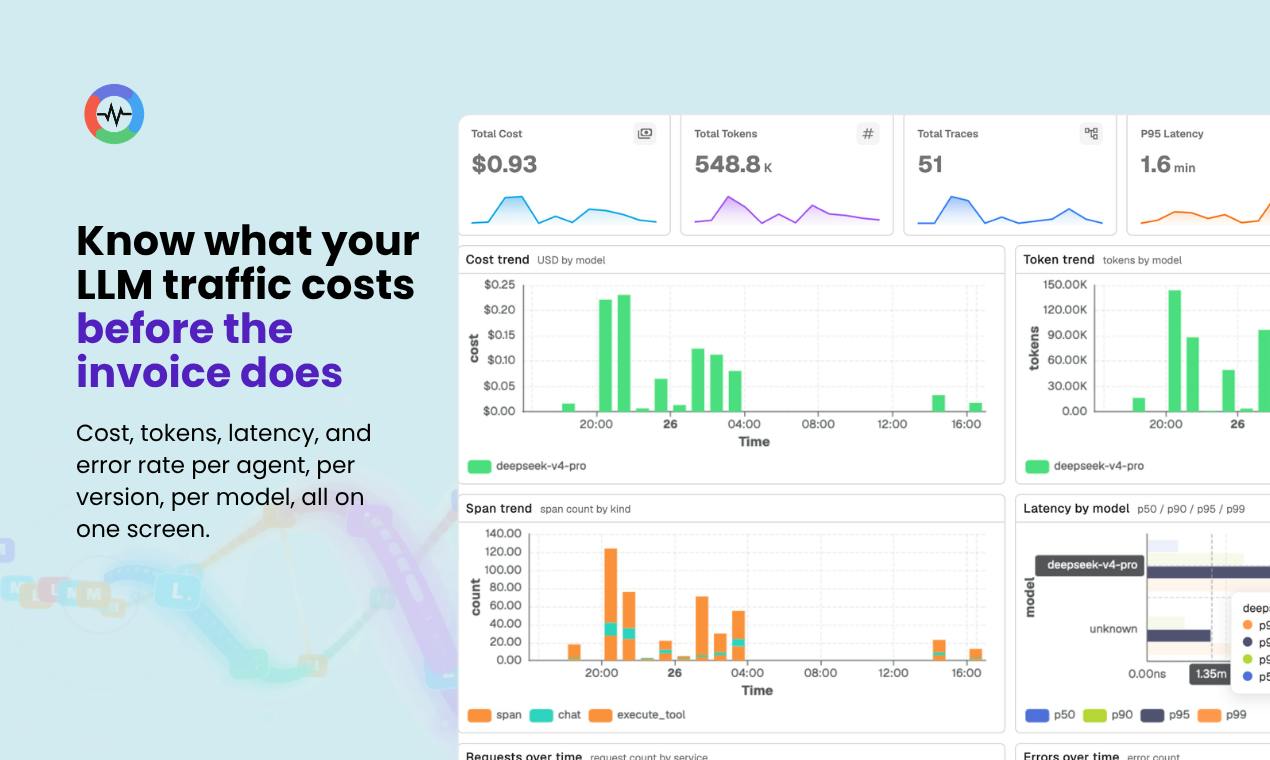
Instead of looking at LLM calls in isolation, we wanted to see the entire session: LLM calls, tool calls, tokens, cost, latency, evaluations, and the infrastructure underneath it.
And because it’s built into OpenObserve, those AI traces live alongside your existing logs, metrics, and application traces. No second observability stack just for your AI workloads.
It’s also fully OpenTelemetry-native, so you can bring telemetry from the frameworks and instrumentation you’re already using.
If you’re already running AI workloads in production, I’d be curious to hear what you’re actually using today to debug them.
PH 用户
Hey Product Hunt, DevRel at OpenObserve here.
We've been building AI Observability into OpenObserve for the last few months, and it's finally live.
Everyone is shipping agents, but most tools only tell you the request went through, not whether the answer was any good. a hallucination still returns 200 OK. that's the gap we're closing.
how?
- trace every agent, tool call and model request
- score quality on live traffic, and run experiments before you ship
- send weak traces to a human, then turn them into eval datasets
More importantly it's one unified platform. LLM traces sit next to your logs and infra, OpenTelemetry native, self host or cloud, priced per GB not per span.
It's in beta and we'd love practitioner feedback. if you're running agents in prod, what's painful for you today?
thanks for taking a look.
PH 用户
If an agent uses many models in one session, can I see how much costs for each model, and total cost for the session?
PH 用户
AI observability 和 APM/Infra monitoring engine 共用同一套存储和查询层吗?
If your AI agent got stuck in a tool-call loop right now, would you know? Would you spot it before your customer did?
We didn't.
During a live demo, our own AI SRE Agent silently stalled. No errors. No timeouts. Nothing useful in the logs.
We had to dump raw spans and debugged through them just to find the loop.
Reading raw spans isn't a debugging strategy—it’s an apology waiting to happen.
So we built AI Observability directly into OpenObserve. We wanted to see inside the black box.
Here is what it actually gives you:Sessions map out every single turn. You see every LLM request, tool call, token count, cost, and exactly what prompt caching saved you.Agent Graph plots your agents, tools, and models onto the exact same service map as the rest of your backend infrastructure.Agent Behavior automatically flags the sessions that loop or fail—long before a user complains.Online Evals let you score live sessions using any judge model (bring your own provider and key).Annotation Queues let you turn those ugly, failed sessions into clean datasets so you can regression-test your fixes.
The best part? It's OpenTelemetry-native.
It normalizes OTel GenAI, OpenInference, OpenLLMetry, and Vercel AI SDK and many more out of the box. Nothing you’ve already wired up goes to waste, and you don’t have to ship a second copy of your data to another platform.
Our SRE Agent runs on this daily now, and it's still our harshest critic.
Point it at your own agent traces. I'd love to hear what you find.
Sessions, not calls. Most LLM tracing anchors on a single request. But agents don't fail at a call — they fail across a path: right answer, wrong tool, fourteen times. So the session is the first-class object, and cost, tokens and scores roll up to it. Spans are the substrate, not the unit of analysis.
One data layer. We could have shipped a separate AI observability product. We didn't — because half of what kills an agent isn't the model. It's a vector DB timing out, a 429 from a downstream service, a retry storm in your own API. If agent spans live in a different system than your infra traces, you get to debug the same incident twice.
Scores are append-only. An evaluation is data, not a label. Change your judge prompt and the old scores don't get overwritten — they get a new version. Otherwise "quality improved" is unfalsifiable.
Bring your own judge. The judge model is yours, self-hosted open weights included. Evaluating production traffic shouldn't require shipping production traffic to someone else.
One thing that genuinely surprised me while building this: the OTel GenAI semconv renamed core attributes twice in two years (gen_ai.system → provider.name, events → input/output.messages). Betting on a fixed schema would have been the real mistake. The mapping layer turned out to be the feature.
What's the worst agent failure you've had to debug straight from raw spans? Collecting these — seriously.
One thing we kept running into while working with AI workloads: an LLM call can succeed while the agent still fails.
That’s the gap we wanted to solve with AI Observability.
Instead of looking at LLM calls in isolation, we wanted to see the entire session: LLM calls, tool calls, tokens, cost, latency, evaluations, and the infrastructure underneath it.
And because it’s built into OpenObserve, those AI traces live alongside your existing logs, metrics, and application traces. No second observability stack just for your AI workloads.
It’s also fully OpenTelemetry-native, so you can bring telemetry from the frameworks and instrumentation you’re already using.
If you’re already running AI workloads in production, I’d be curious to hear what you’re actually using today to debug them.
We've been building AI Observability into OpenObserve for the last few months, and it's finally live.
Everyone is shipping agents, but most tools only tell you the request went through, not whether the answer was any good. a hallucination still returns 200 OK. that's the gap we're closing.
how?
- trace every agent, tool call and model request
- score quality on live traffic, and run experiments before you ship
- send weak traces to a human, then turn them into eval datasets
More importantly it's one unified platform. LLM traces sit next to your logs and infra, OpenTelemetry native, self host or cloud, priced per GB not per span.
It's in beta and we'd love practitioner feedback. if you're running agents in prod, what's painful for you today?
thanks for taking a look.